New Feature Announcement: Risk Dashboards


Today, we’re excited to announce the general availability of a new data and insights feature in our Secure Workforce product — Risk Dashboards.
Available for all Beyond Identity customers today, Risk Dashboards simplify deployment health management for administrators of Beyond Identity. Additionally, it enables IT, identity, and security teams to prove the impact of their efforts. Risk Dashboards achieve these benefits by making it easy to pinpoint device, user, and passkey risk ranked by severity, providing insights for optimizing risk-based policy, and enabling exportable reports that show improvements in organizational risk posture over time.
Get an overview of these features below or dig into our technical documentation.
Instant risk overview
.avif)
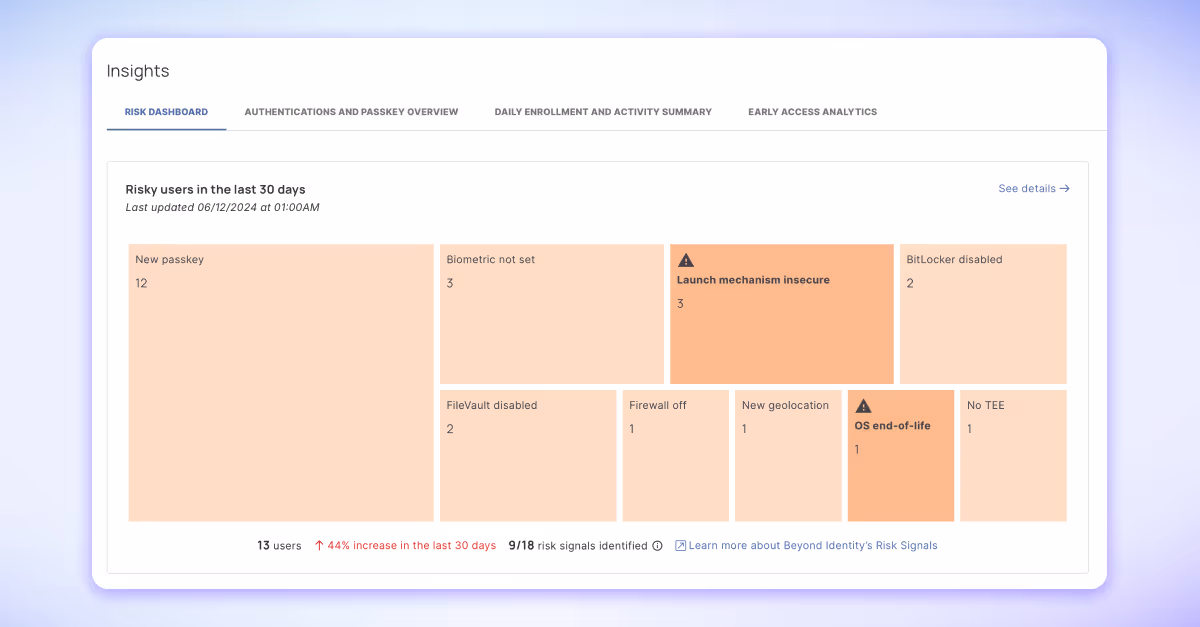
During our initial feature discovery, we heard this common sentiment echoed across Beyond Identity admins that “I don’t have a lot of time to suss out risk, my team is only so big”. So we set out to eliminate the need to go on the hunt for risk. Instead, the admin will now be able to quickly see it and easily get the context needed to diagnose the cause in order to do something about it.
IT, security, and identity admins now can simply log in to their Beyond Identity Admin Console and immediately:
- See 18 risk signals surfaced in the risk overview graph. Each risk signal is designed to detect a particular type of security risk or suspicious behavior using features from authentication events.For the detailed list, please see our technical documentation.
- Rank risk scores by user, automatically calculated based on the number or risks exhibited and severity
- Drill down into each risk signal by user, device, or passkey for deeper context
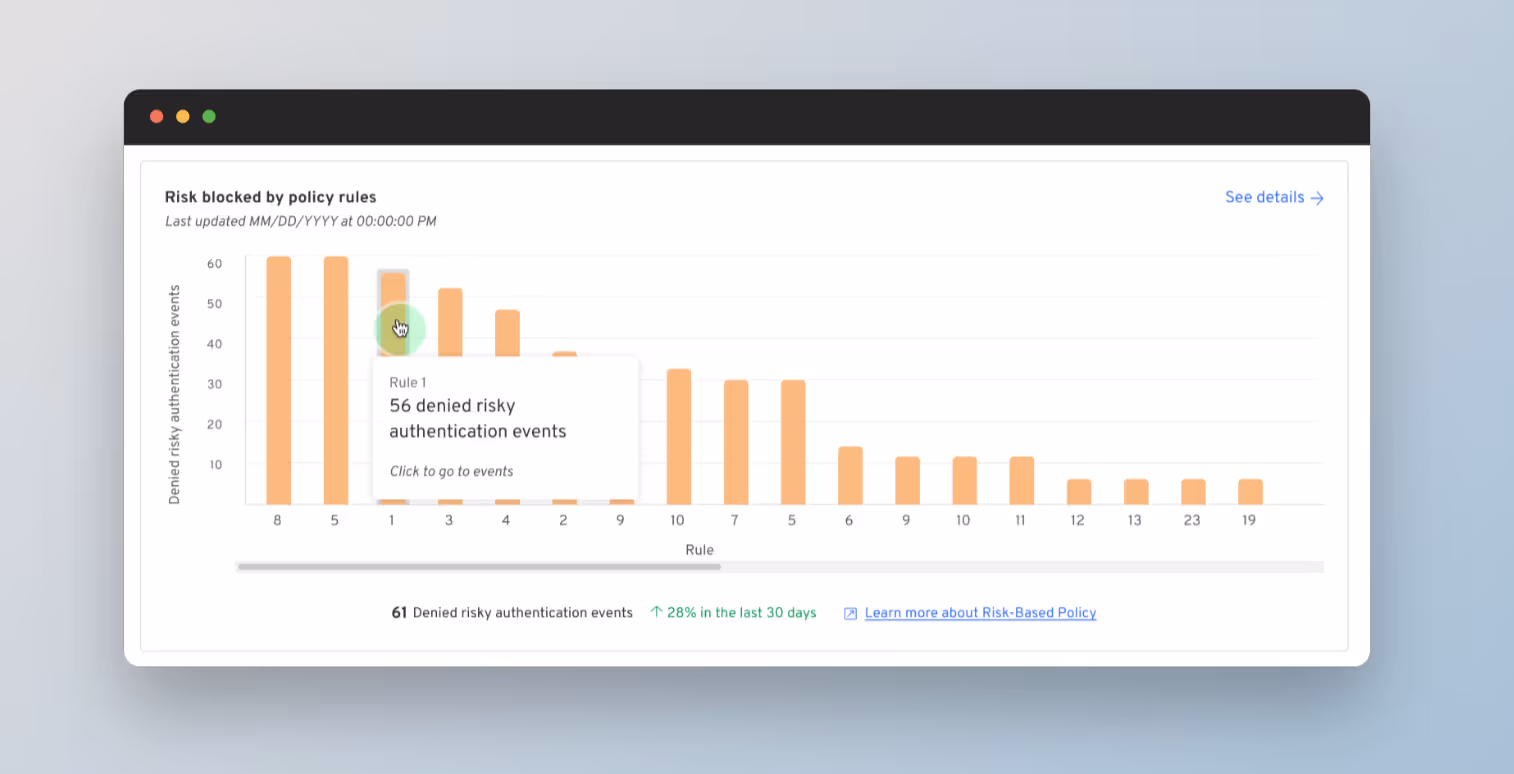
Prove impact of security efforts

An enduring struggle of IT and security teams is proving the impact of their efforts. It’s obvious when access control breaks down, unauthorized access and breaches are measurable incidents whether in number, dollar amount, and/or hours lost. However, when strong access controls are in place, unauthorized access is prevented before it causes harm. But proving the non-existence of something is comparably more difficult than when that thing has occurred.
As part of our efforts to empower IT and security teams to provide evidence of their work’s positive impact, Risk Dashboards provides two charts for this exact purpose:
- Risks blocked by adaptive access policy rules
- Risk by passkeys over time
Along with these two charts that show security policies at work and change in credential risk over time, Beyond Identity admins can also export risk reports to share with other teams or executives to demonstrate security at work.
Simplify troubleshooting

Authentication failures can be caused by a number of reasons. Common reasons include policy denial denials and end-user network interruptions. When authentication fails, it’s the IT admin’s job to know what caused it and ensure that the user is able to gain secure access into the applications and resources they need to do their jobs.
To reduce the cognitive load required to diagnose authentication failures, Risk Dashboards surfaces the following insights to the admin:
- Authentication events impacted by policy rules (and which ones specifically)
- Users impacted by policy rules (and which ones specifically)
- % change in authentication denial by policy
These insights quickly show admins if there’s an unusual spike in authentication denials by policy rules and which policy rules, if any, caused an authentication denial. This allows customers to understand where policy denials are originating from so they can help end-users become compliant.
Optimize risk-based policies
Risk-based access policies are one of the most powerful components of our Secure Workforce product because it allows organizations to enforce continuous, adaptive authentication rules using real-time risk signals gathered natively from Beyond Identity or from third-party integrations (e.g. CrowdStrike, Jamf, Intune, SentinelOne, etc).
However, policy is only as powerful as its configuration. To help customers make the most out of policy, we wanted to provide a consolidated policy analysis that delivers the insights necessary to close the feedback loop and optimize policy over time.
Through Risk Dashboards, customers can now:
- See which policies are impacting authentication events and users
- Understand changes over time in policy denials
- Make data-informed adjustments to policy
Conclusion
The goal of Risk Dashboards is to provide our customers with the insights they need to make better decisions for access controls and demonstrate the impact of strong access controls. We’re grateful for the early preview feedback from customers and look forward to improving this feature over time.
Login to your admin console to try it out today and let us know what you think.
Today, we’re excited to announce the general availability of a new data and insights feature in our Secure Workforce product — Risk Dashboards.
Available for all Beyond Identity customers today, Risk Dashboards simplify deployment health management for administrators of Beyond Identity. Additionally, it enables IT, identity, and security teams to prove the impact of their efforts. Risk Dashboards achieve these benefits by making it easy to pinpoint device, user, and passkey risk ranked by severity, providing insights for optimizing risk-based policy, and enabling exportable reports that show improvements in organizational risk posture over time.
Get an overview of these features below or dig into our technical documentation.
Instant risk overview
During our initial feature discovery, we heard this common sentiment echoed across Beyond Identity admins that “I don’t have a lot of time to suss out risk, my team is only so big”. So we set out to eliminate the need to go on the hunt for risk. Instead, the admin will now be able to quickly see it and easily get the context needed to diagnose the cause in order to do something about it.
IT, security, and identity admins now can simply log in to their Beyond Identity Admin Console and immediately:
- See 18 risk signals surfaced in the risk overview graph. Each risk signal is designed to detect a particular type of security risk or suspicious behavior using features from authentication events.For the detailed list, please see our technical documentation.
- Rank risk scores by user, automatically calculated based on the number or risks exhibited and severity
- Drill down into each risk signal by user, device, or passkey for deeper context
Prove impact of security efforts
An enduring struggle of IT and security teams is proving the impact of their efforts. It’s obvious when access control breaks down, unauthorized access and breaches are measurable incidents whether in number, dollar amount, and/or hours lost. However, when strong access controls are in place, unauthorized access is prevented before it causes harm. But proving the non-existence of something is comparably more difficult than when that thing has occurred.
As part of our efforts to empower IT and security teams to provide evidence of their work’s positive impact, Risk Dashboards provides two charts for this exact purpose:
- Risks blocked by adaptive access policy rules
- Risk by passkeys over time
Along with these two charts that show security policies at work and change in credential risk over time, Beyond Identity admins can also export risk reports to share with other teams or executives to demonstrate security at work.
Simplify troubleshooting
Authentication failures can be caused by a number of reasons. Common reasons include policy denial denials and end-user network interruptions. When authentication fails, it’s the IT admin’s job to know what caused it and ensure that the user is able to gain secure access into the applications and resources they need to do their jobs.
To reduce the cognitive load required to diagnose authentication failures, Risk Dashboards surfaces the following insights to the admin:
- Authentication events impacted by policy rules (and which ones specifically)
- Users impacted by policy rules (and which ones specifically)
- % change in authentication denial by policy
These insights quickly show admins if there’s an unusual spike in authentication denials by policy rules and which policy rules, if any, caused an authentication denial. This allows customers to understand where policy denials are originating from so they can help end-users become compliant.
Optimize risk-based policies
Risk-based access policies are one of the most powerful components of our Secure Workforce product because it allows organizations to enforce continuous, adaptive authentication rules using real-time risk signals gathered natively from Beyond Identity or from third-party integrations (e.g. CrowdStrike, Jamf, Intune, SentinelOne, etc).
However, policy is only as powerful as its configuration. To help customers make the most out of policy, we wanted to provide a consolidated policy analysis that delivers the insights necessary to close the feedback loop and optimize policy over time.
Through Risk Dashboards, customers can now:
- See which policies are impacting authentication events and users
- Understand changes over time in policy denials
- Make data-informed adjustments to policy
Conclusion
The goal of Risk Dashboards is to provide our customers with the insights they need to make better decisions for access controls and demonstrate the impact of strong access controls. We’re grateful for the early preview feedback from customers and look forward to improving this feature over time.
Login to your admin console to try it out today and let us know what you think.
Trending Resources
.png)
Your First 5 Minutes with Ceros: See What You've Been Missing
February 24, 2026
The Attacker Gave Claude Their API Key: Why AI Agents Need Hardware-Bound Identity
February 2, 2026
Beyond Identity Opens Early Access for the AI Security Suite
January 22, 2026
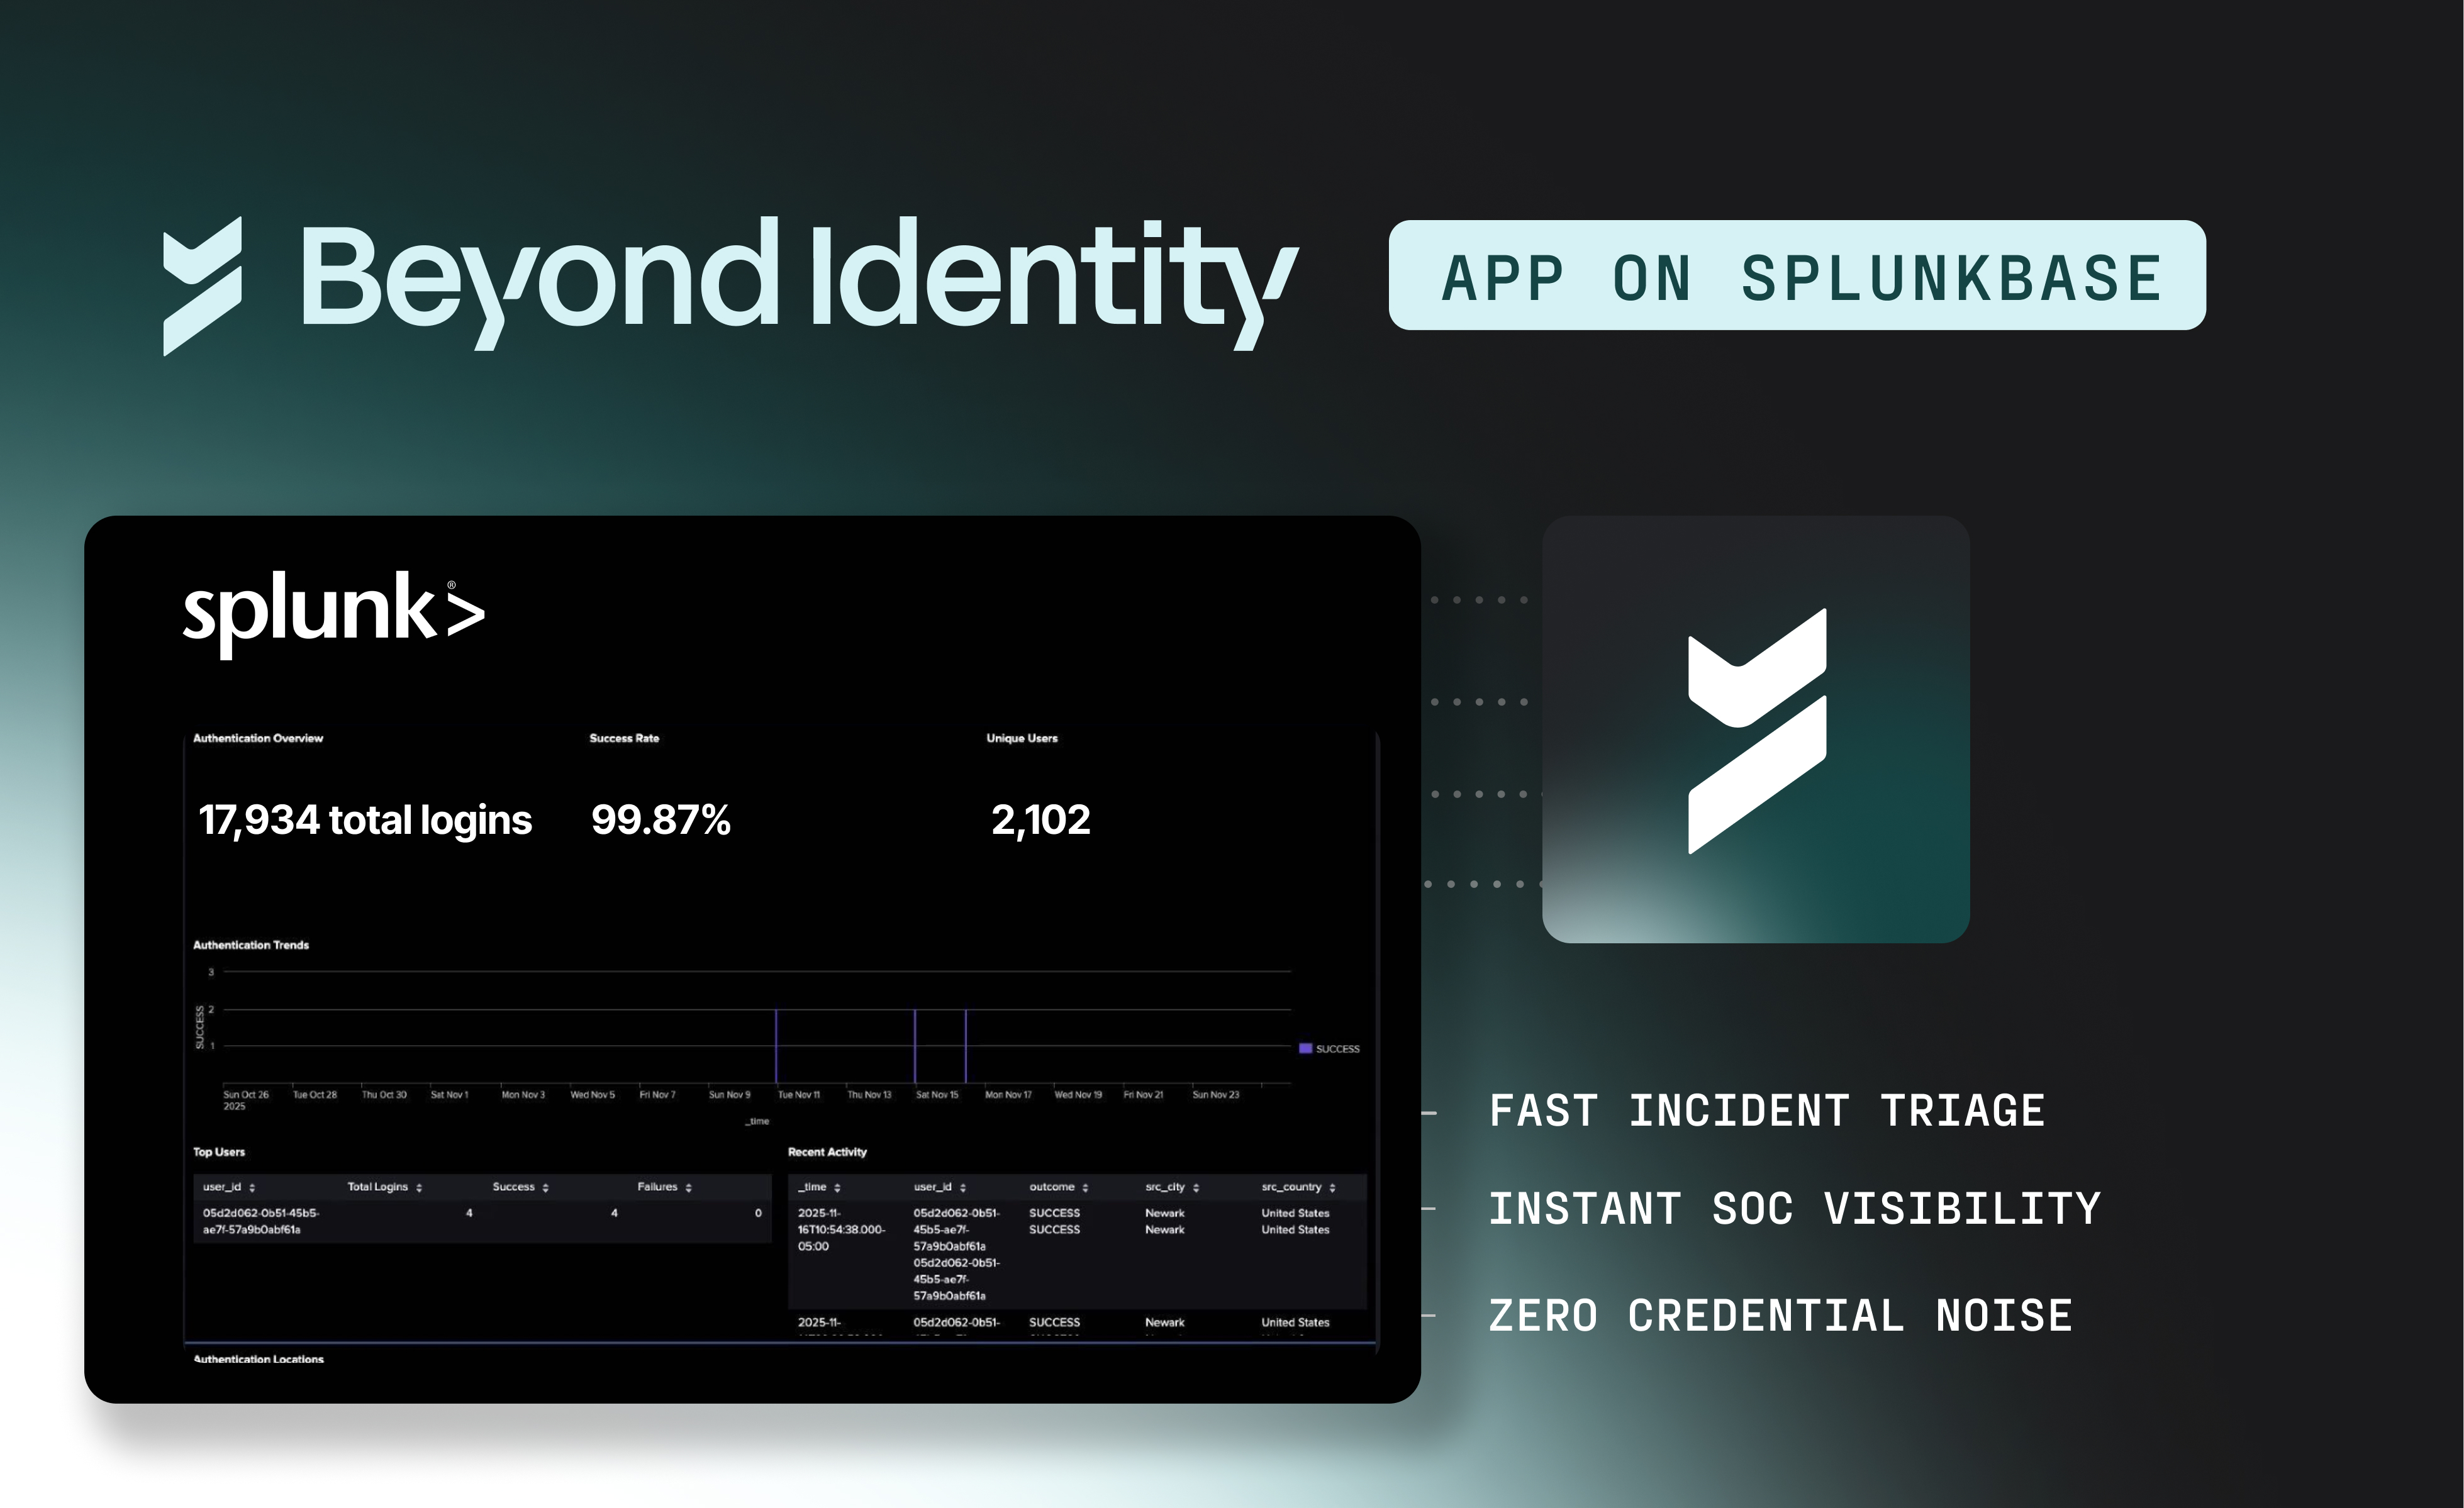
Unlock High-Fidelity Security with the New Beyond Identity App for Splunk
January 16, 2026
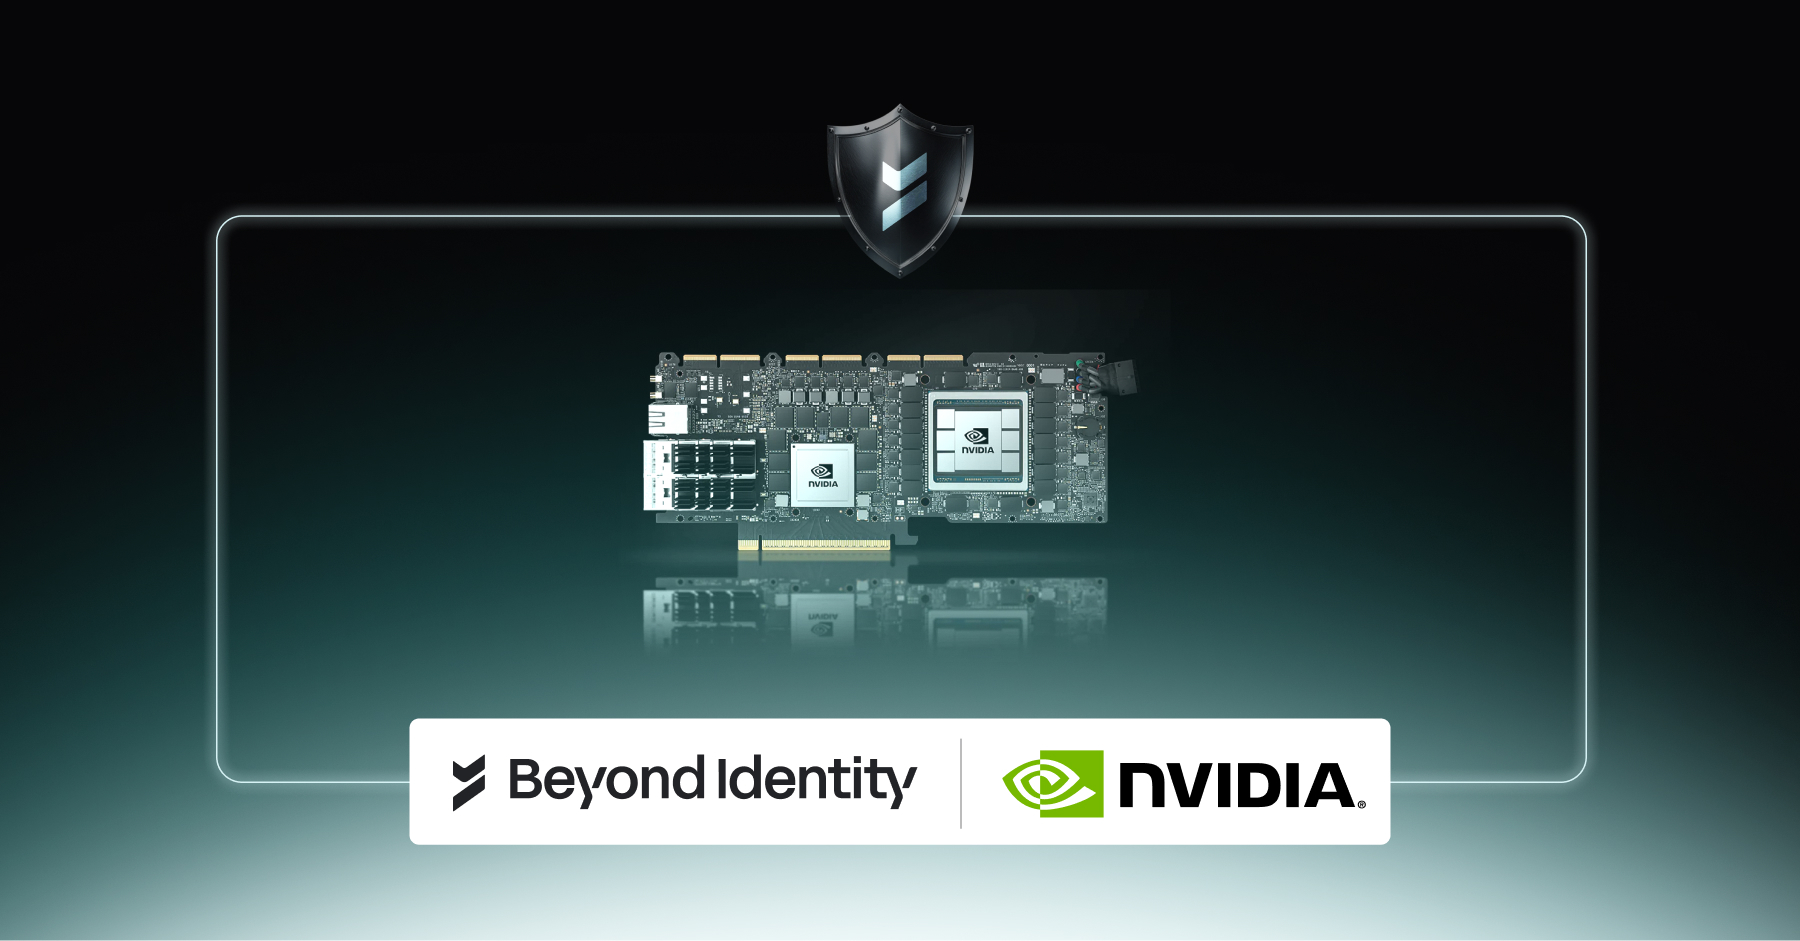
Beyond Identity Joins NVIDIA Inception Program to Advance Hardware-Enforced Security for the AI Era
January 5, 2026

Chips and SLSA: Why TPMs Matter for Code Commits
December 19, 2025

Why Is Code Provenance Non-Negotiable in the Age of AI?
December 17, 2025
.avif)
How Beyond Identity & Nametag Stop Identity Fraud at Onboarding & Recovery
November 19, 2025
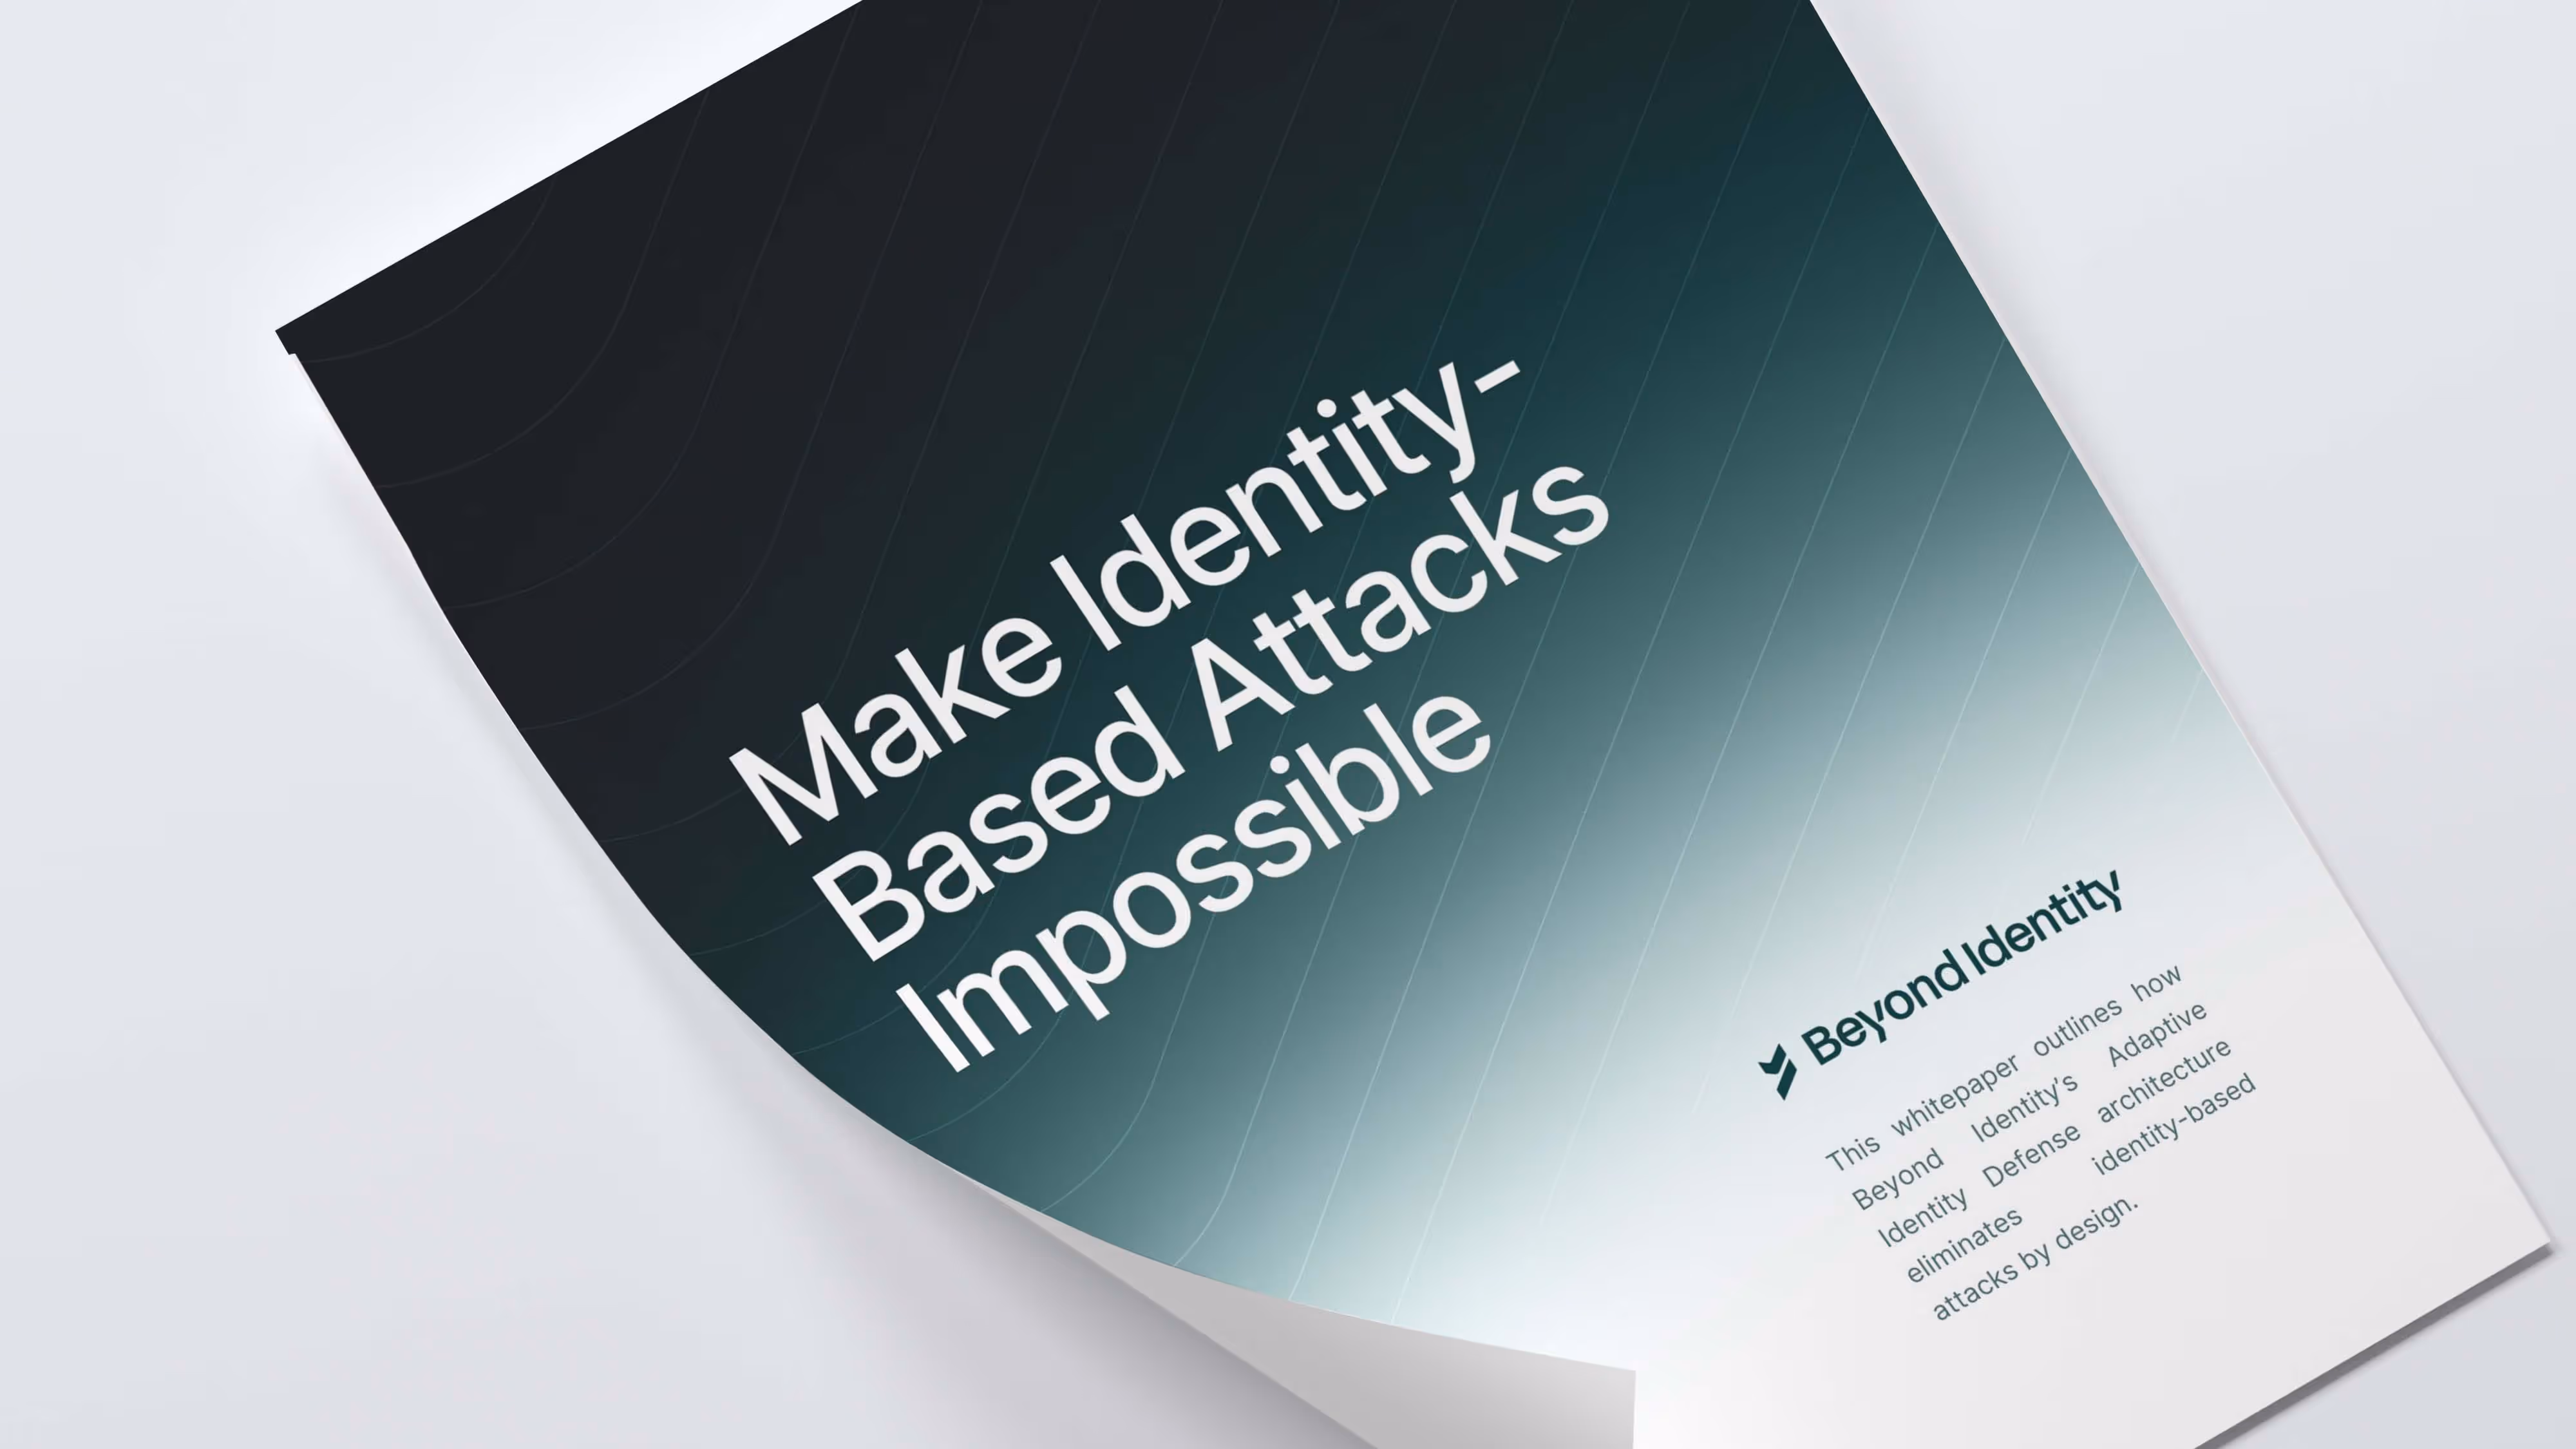
Make Identity-Based Attacks Impossible
August 11, 2025
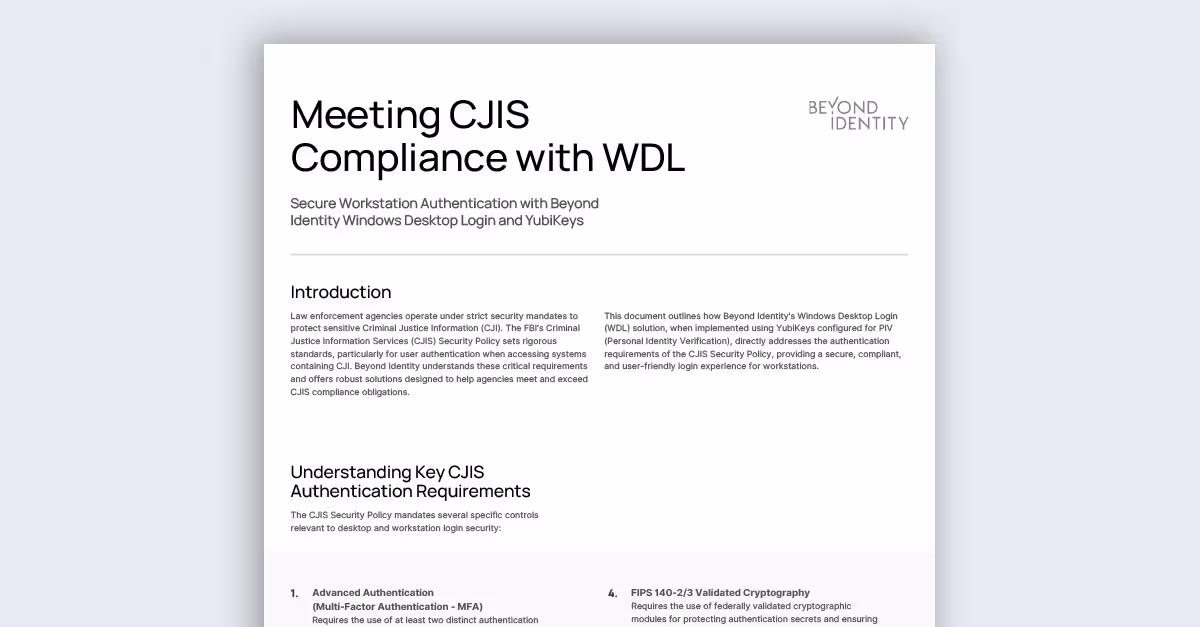
Meeting CJIS Compliance with WDL
May 27, 2025
PCI DSS Compliance with Beyond Identity
March 6, 2025
.avif)
Online Job Board Safety: How and Why To Avoid a Scam
March 7, 2024

ChatGPT's Dark Side: Cyber Experts Warn AI Will Aid Cyberattacks in 2023
February 29, 2024
Improving User Access and Identity Management to Address Modern Enterprise Risk
February 20, 2024

Okta Cyber Trust Report
January 5, 2024

Securing Remote Work: Insights into Cyber Threats and Solutions
October 30, 2023

Networking Dinner with MightyID and Tevora
December 9, 2025
Alphinia CISO Mastermind Dinner
December 1, 2025

Myriad360 Client Appreciation Celebration
November 20, 2025
GuidePoint Security Movie Premeire of Wicked
November 19, 2025
.avif)
How AI Is Accelerating Threats: The Inside Scoop on Emerging Phishing GPTs
November 18, 2025

GuidePoint Security 3rd Annual Houston Golf Outing
November 13, 2025
GuidePoint Security's Pinehurst Golf Outing
November 12, 2025
GuidePoint Security Public Sector Vendor Fair
November 5, 2025
